The following excerpt is from my book “How I Made One Million Dollars… Last Year… Trading Commodities”. The book was written in 1973, and it was the first time I made public my indicator that I had been using since I first started trading futures, stocks, and commodities in 1966.
HOW TO TELL WHEN A COMMODITY IS OVERSOLD
“Enough about concepts and abstracts. Here, exactly, is how I identify an overbought or oversold market.
My method may, or may not be the ultimate answer to Yin and Yang. However, it is the best I have found considering the irrational character of price action and the ease of constructing the index. As an additional bonus, the index is done on a % basis so you know exactly the nature of an extreme. Overbought/oversold indices that use only the price range from one point to another have no absolutes. Thusly, what was oversold at one time period may not be oversold at another.
I’ll refer to the index as % of R, or Percent R. The index is a simple measure of where today’s closing price fits within the total Range of the last ten days.
Let’s say the range for the last ten days was ten points, with the highest high of the last ten days at 65, and the lowest low of the last ten days at 55.
Today’s closing price is 58. As you can see from the illustration the close is quite low, within context of the total range during the last ten days.
In terms of percentages, the close at 58 represents a figure that is 70% of the total range.
Should the commodity have closed at 55, the % would be 100%. That is, the close is 100% of the distance from the top of the range to the close. If prices had closed at 65, the % reading would have been 0 because the distance from the close to 0% of the distance from the high to the close.
The exact formula for arriving at Percent R is first to determine the distance from the highest high of the past ten days and the lowest low of the last ten days. This is the “Range”.
Then, take the difference from the high of the last ten days, which you have already identified, and today’s closing price. We’ll call the “Change”.
All that’s left to do is divide the Change figure by the Range figure and you will arrive at what % today’s price is – out of the past ten day’s range. it’s as simple as that. here’s an example. Let’s say Silver had a high of 280.5 the last ten days and a low of 272.5. Today’s close is 278.5. The Range (high to low) is 80. The Change (today’s close to 10 day high) is 20. When we divide 20 by 80 we arrive at what % today’s closing level represents of the total ten day range. In this case, the Percent R reading is 25%.
Plot this daily reading on your chart paper. It will, naturally, range from a Yang (overbought reading at 0%) to Yin, (an oversold reading at 100%). Generally speaking, readings below 95% give a buy indication – during bull markets. A reading above 10% gives a sell signal during bear markets.
The preceding paragraph is the essence of my technical system. The Percent R index will not work if you insist on acting on thee buy signals during a bear market. Now you realize why I have, in earlier chapters, stressed so strongly, the necessity of isolating the dominant bull and bear markets. Once you have done that, all you have to do is track price movements with Percent R and wait for the signals telling you it’s time to start positioning the commodity according to the fundamental situation we have discussed.
Let’s review some examples of Percent R at work to see its limitations as well as its advantages and historical record. As you will see, it always calls the best buy and sell areas. This is a dandy index.
TIMING YOUR SILVER TRADE
Here’s a chart of December Silver starting on November 17, 1972 through November 1, 1973. During this period, silver was in a well-identified bull market as I repeatedly indicated in my advisory service at the time. This means our interest in the Percent R Index was strictly on the buy side. The signals we would “work” were those given by Percent R dropping below 95%. In total, eight signals were given. All predicted immediate rallies of at least a full cent. That’s a $1,000 profit per contract.

There is one “bad” period which I’ve been careful to mark on this chart. This is an example of when Percent R signals can go haywire. This is the only screening you have to make on a buy signal in a bull market.
If prices have recently undergone an extremely rapid rise, exhibiting signs of a technical blow-off, (that means prices will stage a wild, upside move then immediately limit down without trading) wait for a buy signal from the Percent R Index. You are through waiting and ready to buy, when:
1. Percent R has hit 100%,
2. Five trading days have passed since the 100% reading was hit,
3. Percent R again falls below 95%.
Once those three criteria are met, it’s time to once again begin acting on the Percent R signals, assuming you are buying long in a bull market.
Unless there has been a wild, speculative blow-off in the bull market, you should try to position every time the index falls below 95%. This procedure assures that you are buying on extreme weakness at a time Yang is about to overtake Yin.
Not all signals will be correct. I have constructed no perfect indices. The Holy Grail is yet to be found. Because of that, I use a few other tools to confirm the Percent R and I use stops as my ultimate protection. Yet, Percent R remains the best timing tool I have ever used for determining overbought or oversold markets.
SOY BEAN OIL AND SUPER PROFITS

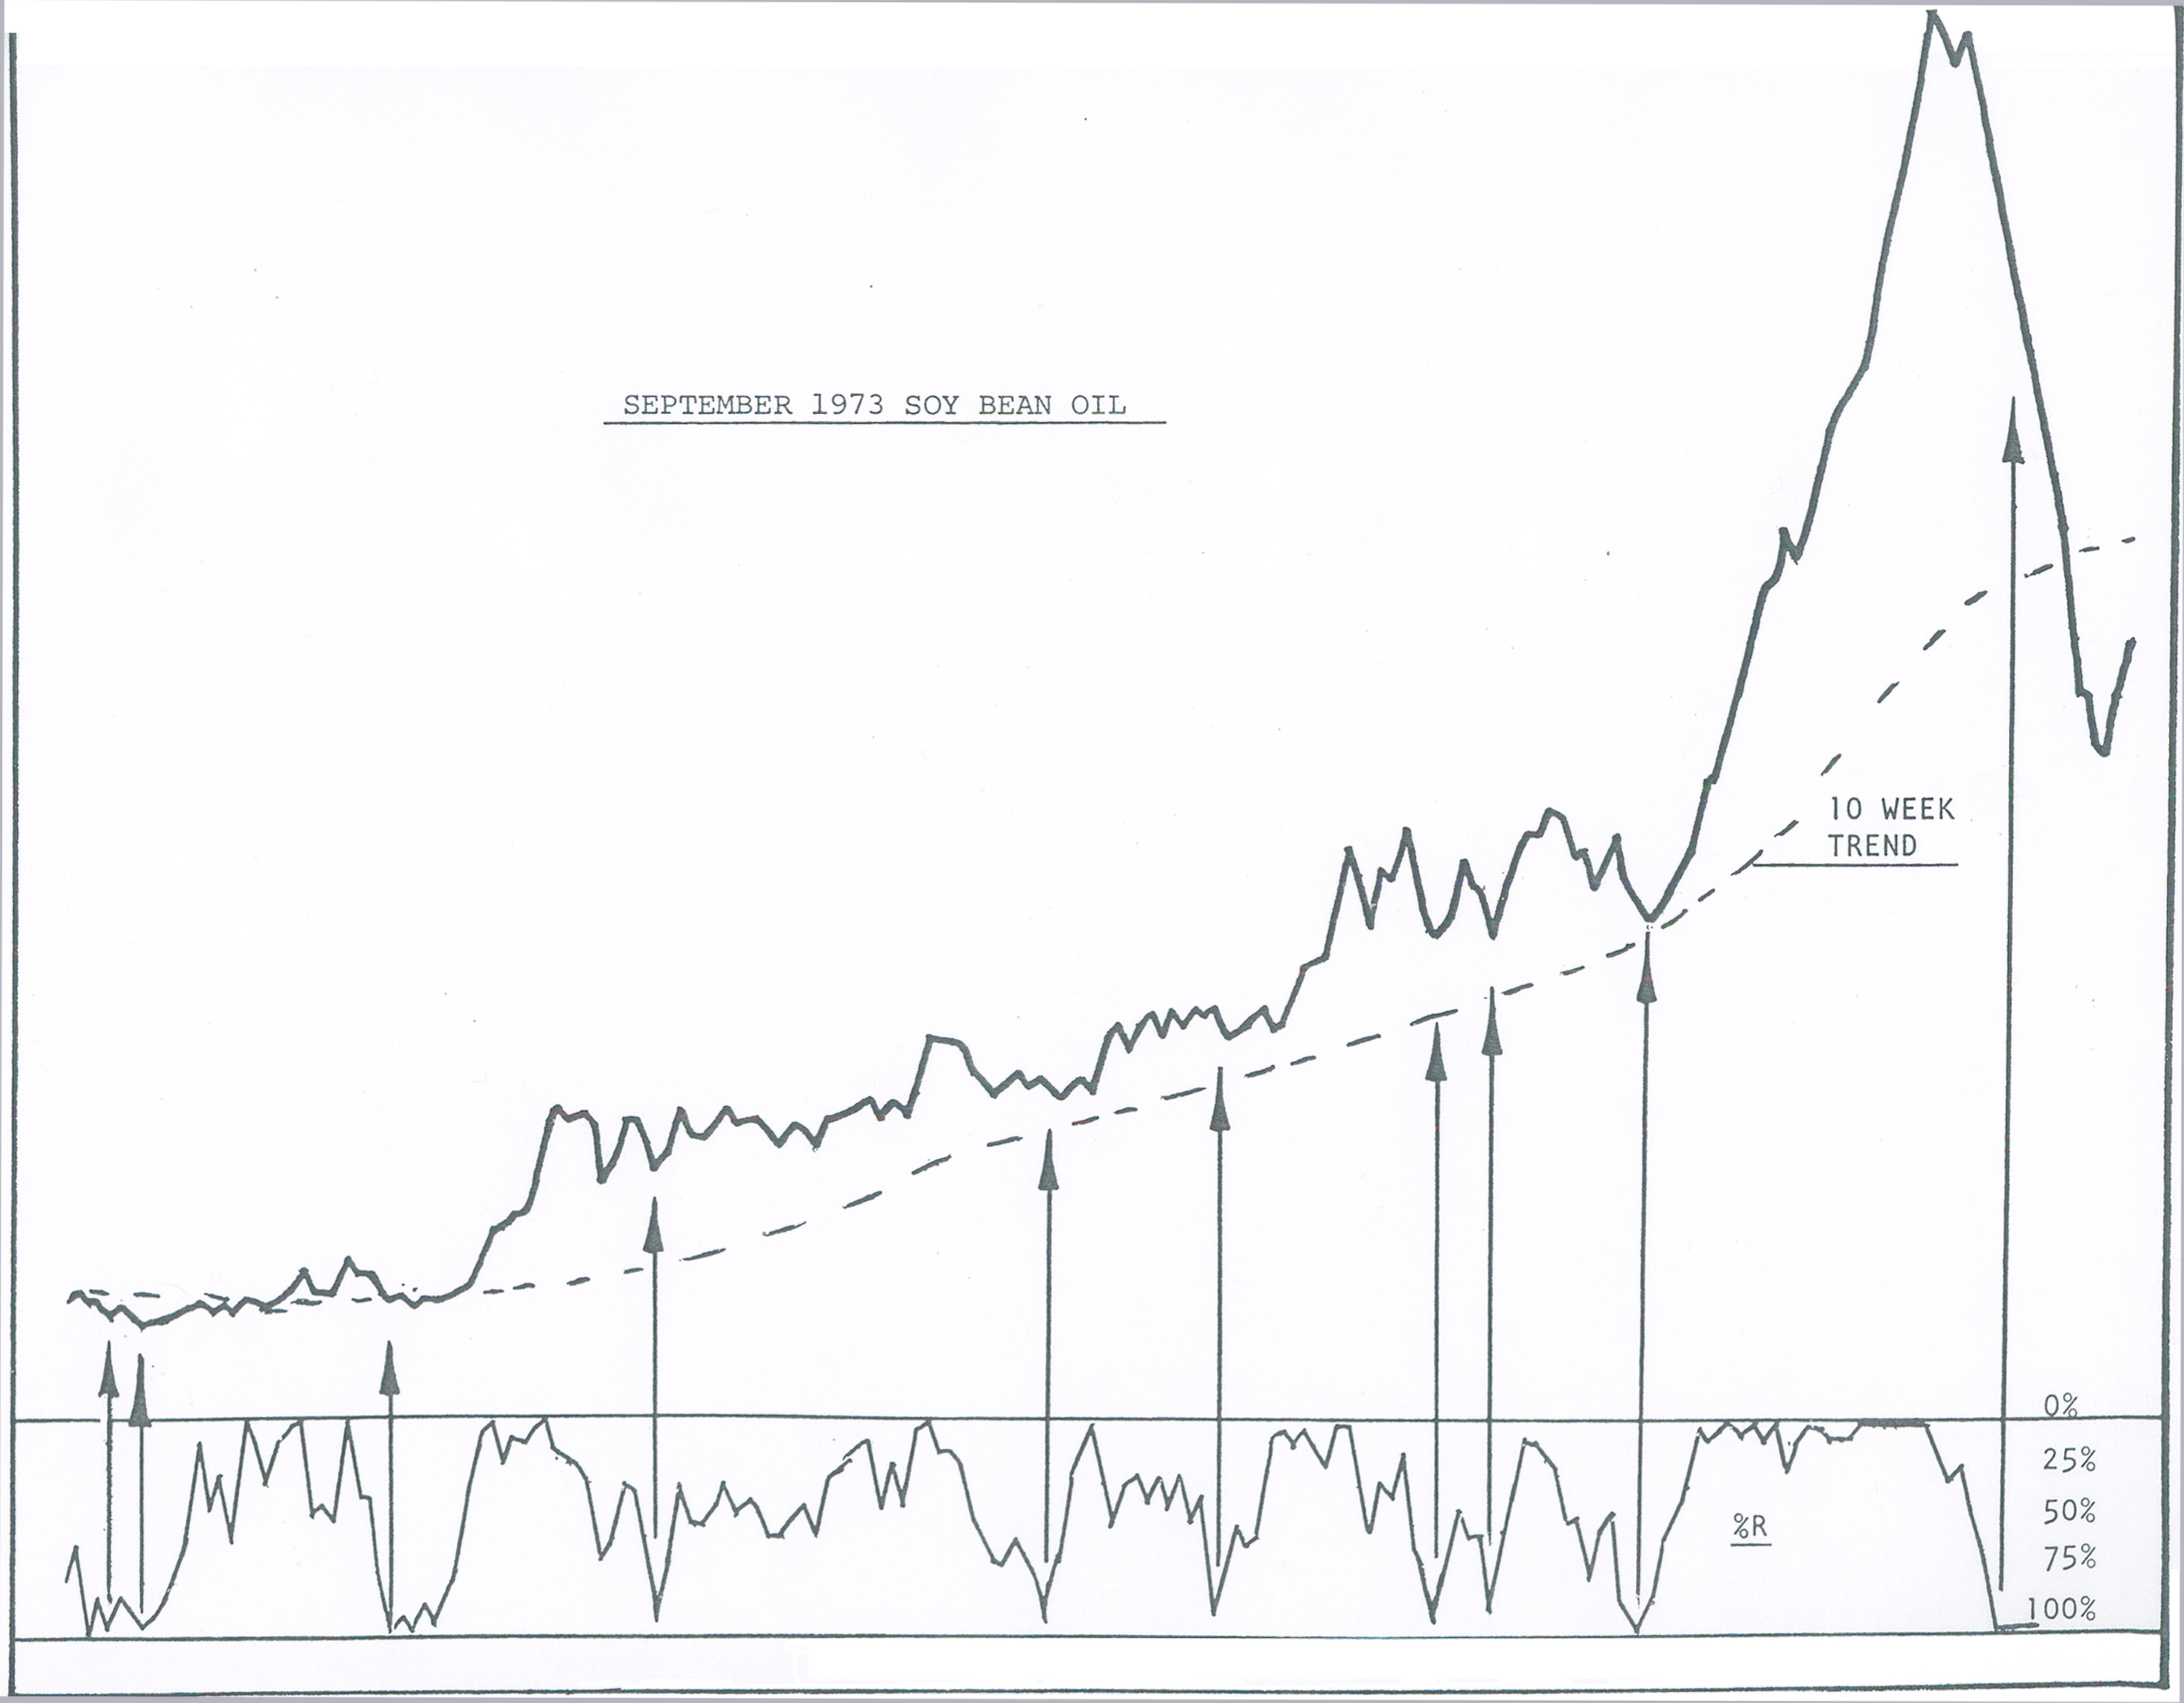
During 1973, Soy Bean Oil was also in an easy-to-identify bull market. Open Interest had several huge reductions. A premium appeared and large traders were long. All signs were “go”. It was only a question of selecting optimum times to buy. Enter, Percent R!
In the ten month chart of Bean Oil prices, ten signals were given by Percent R as I have marked on the chart. All but one of the signals was followed by immediate and substantial gains. That’s not bad! Alert chartists will notice the signals come when prices are extremely weak. Thus, you are almost always able to buy into massive weakness… not after a turn has developed.
Indeed, that’s the beauty of the index. While most gauges wait for a turn to develop. Percent R identifies the exact low point, give or take a day. This means, you can wait until after the signal is given – no deed to trade during market hours 0 and place your order for the following morning open when prices are on the skids following through the previous day’s liquidation. That’s a humdinger of a time to take down large, large positions.
THE SECRET OF SELLING SHORT
We reverse our procedures for selling short with Percent R. We look for a well-defined bear market. that means, prices have been trending lower; Open Interest is on the increase, there are no premiums and the nearby months are weaker than the distant.
Our next move is to wait for Percent R to zoom up to 10% or less. Notice the beautiful sell signals given in Plywood during the 1973 market period (Yes, Virginia, there were bear markets).

At this point,Yin is about to overtake Yang and market traders begin selling to the newcomers. Here, the exact day of the high was called quite well by Percent R. The index has a great ability to call our attention to many major selling levels in bear markets.
IDENTIFYING A SELLING POINT FOR BEANS
In September, 1973 Soy Bean were in a well-identified bear trend. a quick glance at the chart makes that quite clear. The alter trader was ready to sell short. The question was, when, and could Percent R spot the selling time?

It did in sterling fashion. The tool raised to 11% telling us it was time to short. The next day it was up limit and we had our sell signal at 680. The following day it was all over. Beans took a dive down to the 590 are. Had you sold one contract at 6890 and covered at 590, on a margin of $3,000, you would have had a newt gain of over $4,000 just ten days later!
Your bear market strategy using Percent R will be to wait until Open Interest has had a sizable increase (while prices remain in the bear market), and then Percent R hits the selling area at 10% or less. The final indication that you should pull the trigger comes the day after Percent R gives the sell signal.
Let ’em have it with both barrels. Place your stop, walk away. Your work is done for the time being!
HOW TO HANDLE TRADING RANGES
Most technical systems are butchered during trading ranges. How about Percent R? Well, as a matter of record, it was designed to help me as it identified the tops and lows of trading range markets with explicit exactness.
March 1973 Sugar is a good example of an extended trading range market. My work gave convincing evidence prices would go higher. Yet, in a trading range, a buy and hold strategy is not as successful as a buy and sell policy.
During such situations you buy when the Percent R hits 90% or lower. Sell and short when it bounces back in the 10% range. You will find an amazing degree of correlation between trading range tops and Percent R peaks. Ditto for bottoms.
Trading ranges mean prices are locked into supply on the topside and demand, underneath. Usually, supply comes in with a high Percent R reading and demand returns when Percent R falls back to the low buy area.
HOW TO COMBINE MOMENTUM WITH %R (Percent R)
You now have an understanding of momentum, overbought, and oversold. It’s time to synthesize the two. While I have told you to explicitly use the ten day basis for Percent R in the measurement of momentum, there are other time periods to use such as the twenty-five days, etc. Choose whichever seems to be working best based on the current cycles. That’s the key to momentum – extracting the correct time period – then using the momentum approach.
That’s what I do. Yet, people are always asking me for a uniform time period in which to work. Unfortunately, there isn’t any. But, if I’m really pressed, I tell people that a twenty day period is optimum, especially if they take a twenty-day moving average of price and then determine how far above or below that average is today’s price.
The math is easy. Take the last twenty days’ closing prices and divide by twenty. Then take the difference by which today’s closing price is greater or lesser than this twenty day figure. This difference will oscillate above and below a line that represents uniformity in price or zero difference.
The signals are generated by a long term break in the momentum trend line. When that occurs it tells us prices have lost their power and a trend reversal is in gear. Get ready!”