My 18 bar entry technique
Presenting an easy way to ride major trends…
By now I hope you come to understand the emotional aspects of trading as well as the strategy I use in finding markets set up for major moves. You have also learned the basics of my money management approach; that I bet small to win big.
There’s still so much I want to teach you. In this lesson I’m going to teach you an entry technique I’ve been using for almost 20 years.
Most traders are always looking for an entry technique. The think it’s all about having something that flashes buy and sell signals, telling them when to buy or when to sell a commodity.
You are so far ahead of "most traders" because you know it is more important to have a market set up, that you will use conditions with a real track record of telling us when the market should rally or decline.
The entry technique I’m showing you next should be used only when there is a condition present for the market to rally or decline. In other words, I don’t take every signal that occurs in this technique. I only take ones that occur when a conditional trade is apparent.
Keep in mind I teach six different qualifiers to determine when the market is set up to rally or decline. We want to have three or four of those qualifiers present so we can then bring in our quiver full of entry technique arrows.
As mentioned earlier, markets don’t top and bottom the exact same way every time. That’s why we need several entry techniques. The one I’m going to show you now is very simple to follow. You can access the tools on any software and has very simple rules. Let’s get started.
I call this my 18 bar entry technique because I use the 18 day moving average of closing prices. Oh my gosh… Did I forget something?
My setup conditions are all done on weekly charts, the seasonal patterns, the COT Reports and the other five set up techniques I teach, come from looking at weekly charts. Once we get a set up on a weekly chart we then go to the daily charts. We are going to do that now with my 18 bar entry technique, to take our position in the market.
18 bar entry technique
I use a simple 18 day moving average of closing price. There are a wide variety of moving averages to choose from. Frankly, I have found it does not make that much of a difference which one you use, just stay with the same one. (I actually do prefer the 18 bar simple moving average)
Many people will take a buy signal when prices close above the 18 day moving average. However you can see on the following chart that often prices close above then close right back below the average. So they get whipped. Others want to see a daily low above the 18 day moving average. That’s not a bad technique, but there is a better one.
What I look for are two consecutive lows above the 18 day moving average… but I still don’t take action… because price may slam right back down through the 18 bar moving average.
My entry technique comes when price rallies above the highest of the two bars above the 18 day moving average.
That is my entry point, so I know in advance where I can place a buy without having to watch the market on an intra-day basis. My stop loss for the trade would be below what I have bought off of or an 18 bar sell signal. (Yes, this technique works for stocks as well)
Let’s take a look at the charts…
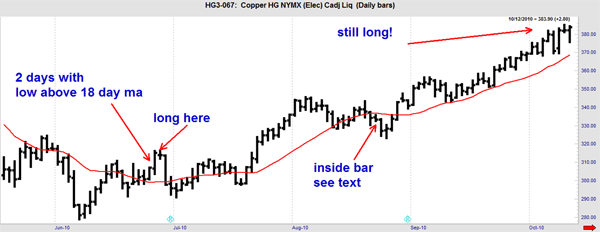
Shown above is Copper on a daily basis in 2010. The red line is the 18 day moving average. We see that price does oscillate back and forth above the moving average quite often. Yet, there is only one instance on the chart where we get two days with lows above the 18 day moving average. This is a rare occurrence. We then buy at the highest of those two bars. I have marked this with the "long here" arrow.
If Copper was set up at this time, then we would’ve had an official 18 bar entry as I have marked off.
Frequently price immediately moves up, but in this case it did not. Instead it bounced around back and forth for about three weeks before the move began. But once it began, there were not an 18 bar exit signal through at least October of that year.
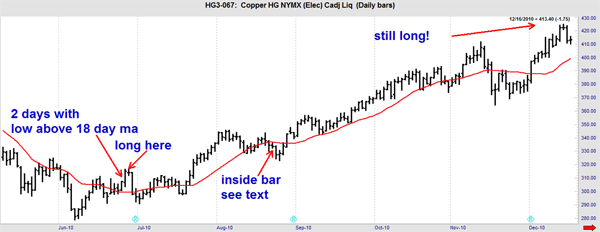
Going into December there were still not two consecutive bars below the 18 bar moving average (that exceeded the lowest day’s low), despite the pullbacks seen in early November as well as the end of that month. The 18 bar entry technique was telling us the trend was still up!
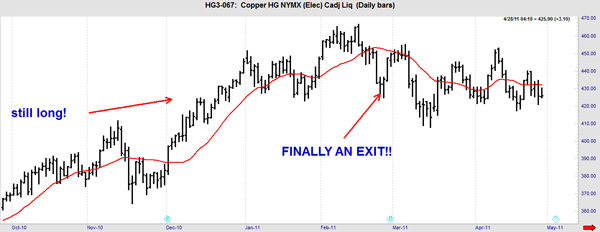
And finally… finally there is an exit in February 2011 when we had two consecutive bars with highs below the 18 bar average and then it trades below the lowest one of those bars.
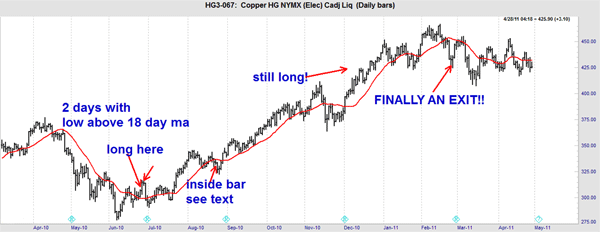
To look at the entire trade simply stare in awe at the next chart…keeping in mind I developed these rules over a quarter of a century ago.
And if you want to see an exceptional example of this entry technique you need look no further than Silver in late 2010 and into 2011. There were two 18 bar entry techniques presenting sterling runs to the upside. The last long trade in February 2011 had almost $100,000 of open profits.
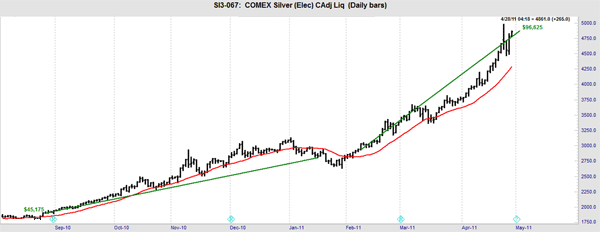
There are other entry techniques I use but if you are looking for a long-term trend following entry, this is one of the best. It is easy to follow, the rules are simple. Of course we have one more rule dealing with inside days and recycling the count, but you get the basic idea from looking at my presentation here.
The idea is to look for an entry when the market is set up. Then take the 18 bar signals. Any entry signal, without a condition in the marketplace to back up that entry, will not be profitable. What I’ve tried to teach you in these lessons is the importance of conditional trading coupled with mechanical entry rules.
Larry
