What really moves the markets?
Charts don’t move the markets.
Conditions move the markets…
It is time now to show you one of the most powerful market indicators of them all. Many of my students trade with just this one indicator; it represents trillions of dollars invested by the big guys. The big guys are the ones that move the markets. They know more than we do.
Here’s how to follow them…
Each week the United States Government publishes the Commitment of Traders Report (COT Report). This report shows all of the buying and selling, done the prior week by the various "players" in the market. Essentially there are three groups; they are Commercials, Large Speculators, and Small Speculators. The report is issued at the end of each week based on information through Tuesday of that same week. It can be accessed at http://www.cftc.gov/marketreports/commitmentsoftraders/index.htm.
I began following these groups of traders in 1970 before anyone else was aware of the reports. I think I can truthfully say no one has had more experience with following this report. Several of my students have based careers on this information. They have done good work. I have always found it best, to go to the source, on any information. In this case it’s me, and you are here at the source. Not only because I have four decades of working with the data, but also because the newest innovations in using the COT report have all come from my work.
It is critical that you understand these three different groups of traders or investors. Let’s begin with the Small Speculators. For the most part this group of people is just like you…these are people looking to buy low, sell high and made a quick dollar or two from actually trading the markets. By and large, this group is selling at market lows and buying at market highs. In other words, they tend to do the wrong thing, most of the time.
The second group, Large Speculators has changed over the years. They used to be people like myself who trade in large quantities. Now, for the most part, it is the commodity funds that make up this data. It used to be there were no commodity funds. Now they have become one of the largest players in the marketplace trading billions of dollars. They are primarily trend followers. It is very difficult to use of this information, from this group, to predict market moves. That is because the way they buy is to buy on a scale up or sell on a scale down. You’ll learn in my course how I use them.
The last group, the Commercials, represent what the industry is doing it. The Commercials are the people that produce or use the commodity. A good example would be someone who grows Soybeans; that’s a producer as is someone who mines Gold. On the other side of that you have the user, someone who processes Soybeans into a variety of products, or someone who takes physical delivery of Gold and makes jewelry or uses it for computer chips. In other words, this group represents the industry. They represent the smartest money. They’re not trend followers. They are not speculators in the marketplace; they do not try to buy bottoms and sell tops.
Commericials use the market to facilitate their business. They hedge… by definition…they are hedgers in the marketplace. That is also explained in more detail in my course. For now though let’s just look at their track record.
Here’s a chart of Gold. In the top pane you see the daily price of Gold. In the bottom pane, in red, you see the net long position of the Commercials. When that line is rising, they are buying. When it is declining, they are selling. Additionally, you can see the Large Speculators (the blue line) and total Open Interest is represented by the black line.
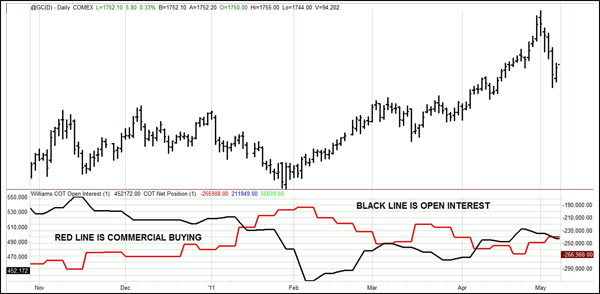
It was very clear in early February of 2011 that the Commercials were heavy buyers in the Gold market. Week after week, they increased their long position. That was a tipoff to the potential rally, which resulted in almost $22,000 per contract. As you can see, the Commercials move the price of Gold. This has nothing to do with chart formations, waves, astrology or some mystical approach to the market.
Markets move because of conditions; when the Commercials are heavy buyer prices usually rally. When they are heavy sellers, prices usually decline. It is as simple as that.
To make it easier to see what the Commercials are doing, I have developed what I call, my Williams COT indexes. I have these for the Small Speculators, Large Speculators, and Commercials. They are unique to my work. No one else uses them as I do. Let me show you an example in another market where we will use the index as opposed to the net position of the Commercials.
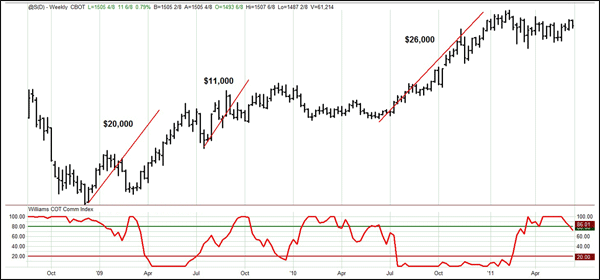
Here we are looking at Soybeans on a weekly chart. The rules are really quite simple. When the index is high, above 75%, we want to look for buy signals in the market if the market is in an uptrend. If the market is in a downtrend, we want to take sell signals when the index falls below 25%
That’s not too difficult, is it? You can see the magnitude of some of the rallies that were triggered by my COT Index. Some are of great significance, while others only made $10,000 or so. But, the point is, as you can see, thanks to the Commitment of Trader Report you can see what the Commercials are doing…they drive the marketplace.
Now you know why I’m not much on all the wiggles and waggles the technical analysts talk about; their wedges and heads and shoulders and all those things only show what price did. They are not indicative of where prices going, as they are not fundamental to the markets.
It’s time for a pop quiz!
I’m going to show you a chart directly below of a market you are not aware of, but I’m not going to show the price of the market. I’m just going to show the COT Index. What I want you to do is determine the times you would be a buyer in this marketplace.
What you should be looking for is when the index is above 75%. At those times you should be taking buy signals, right? You did learn that didn’t you?
Okay, let’s take a look at the chart and then you determine when you would’ve been a buyer for whatever market this is.
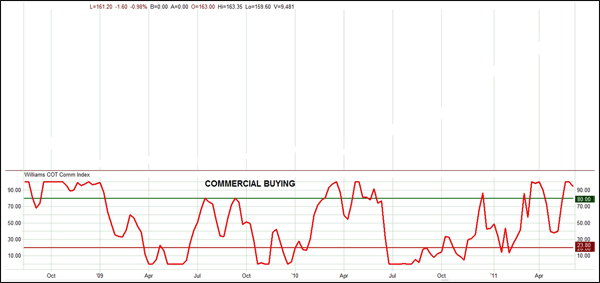
The chart you’ve been looking at is a chart of Coffee on a weekly basis. You cannot see the price action. You have no clue what exactly it did. But you can see my COT Index and determine when it is in the buy zone, above the green line. Of course, falling below the red line when prices are in a downtrend would set up sell signals.
The next chart pulls back the screen so you can see price as well as the indicator together. How did you do? Were you able to determine the times when price would rally or decline?
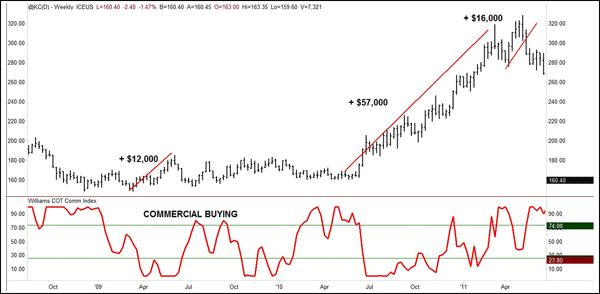
How about that? Without knowing what the commodity was, without understanding much about commodities, you have been able to correctly calls significant rallies and declines in the Coffee market.
This is not an unusual or hand selected example. Once you learn how to use my indicators you will see many similar instances of the power of this indicator.
There two closing comments I want to make. First of all my COT indicators are different from every one else’s.
I also look at more than just the indicators. I show my students how to understand the interrelationship between these three groups of traders in the marketplace and Open Interest. It is very eye-opening when people see how the traders are actually interacting with each other. This is of great value in determining when the market will rally or decline.
I hope by now you understand that there are things that cause markets to rally. These things are not complex. They can be learned, just as you learned in the last few minutes. If you want to become a good trader, you need to know about the markets. You need to study them and that’s why I offer our courses. If you haven’t taken a look at them yet you may want to go to my web site (http://www.ireallytrade.com/lwu.htm) and see what is covered in the courses. I have been doing this for almost 50 years…my courses will save you years of looking and wondering and wandering.
In a few days I will be sending you the third lesson which details one of my entry strategies that will get you into and out of a market…keep your eyes open for it.
I hope you enjoyed learning.
Best wishes for good trading,
Larry